Pokémon Market Report August 2026
"The market is heating up." "The market is crashing." You read both constantly, usually without a single figure behind them. This report does it the other way round: 2,926 Pokémon cards, 30 days, measured rather than guessed. The result is unspectacular, which is precisely what makes it useful — with one exception worth looking at.
The result in three sentences
Between 13 July and 12 August 2026, the Pokémon market barely moved on average: the median card lost 0.7 percent. Around 44 percent of all cards changed by less than ten percent — for the majority, in other words, nothing happened at all.
The interesting part sits one level down: cheap cards stood still, expensive cards gave ground. The higher the price bracket, the more negative the change. That is the only clear pattern in this data — and it contradicts the widespread hunch that "the good cards" always go up.
The data and its limits: The analysis covers Cardmarket trend prices for 2,926 Pokémon cards that cost at least €1 on 13 July 2026 and were still tracked on 12 August 2026. It is a slice of the market — the cards that TCGPriceTracker users hold in their collections — not a complete market overview.
What exactly was measured
A word on method, because it decides whether the figures are worth anything.
The period covers 30 days, from 13 July to 12 August 2026. A longer window would be tempting, but it does not work cleanly: the comparison requires the same card to have a price on both reference dates. The further back the first date sits, the smaller that overlap becomes — and the less it says about the market. A rolling 30-day window also has the advantage of keeping the reports comparable with one another.
The selection starts from the Pokémon cards that users actively track in TCGPriceTracker — cards someone actually owns or watches, not an arbitrary database dump. That is the reason for this particular set of cards: it reflects what the market actually cares about.
From that pool, only cards with a price on both reference dates enter the analysis, and only those starting at €1 — with cent amounts, a change of a few cents produces triple-digit percentages and distorts any statistic. That leaves 2,926 cards.
The metric is the Cardmarket trend price, a weighted average of recently sold items. And the figure reported is the median, not the mean: the median describes the middle card and cannot be bent by individual outliers. A mean would have painted a completely different and misleading picture here — the section on extremes explains why.
The overall picture: standstill
| Change | Cards | Share |
|---|---|---|
| Rose | 1,241 | 42% |
| Fell | 1,497 | 51% |
| Unchanged | 188 | 6% |
| Total | 2,926 | 100% |
Slightly more cards fell than rose, and the median change was minus 0.7 percent. In practice that means: the market moved sideways over these 30 days. Anyone holding a collection during that time is likely to see a largely unchanged total value.
The spread makes it even clearer: 1,280 of the 2,926 cards — 44 percent — moved by less than ten percent in either direction. Only 254 cards, just under nine percent, changed by more than half their value.
The real finding: price brackets diverge
Split the same cards by their starting price, and the calm overall impression breaks into two very different halves.
| Price bracket on 13 July | Cards | Median change |
|---|---|---|
| €1 to €5 | 1,229 | 0.0% |
| €5 to €20 | 850 | 0.0% |
| €20 to €100 | 597 | −4.5% |
| €100 and above | 250 | −6.4% |
The pattern is unambiguous and runs in one direction: the more expensive the card, the weaker the month. Cards under €20 stood exactly still — the median is zero. From €20 upwards it tips into negative territory, and the segment above €100 fell the hardest.
Why that is plausible: cheap cards are bought mainly by players and collectors, and that demand is steady — it follows need, not market conditions. Expensive cards, by contrast, are rarely bought on impulse. They react more sensitively to hesitant buyers, larger waves of selling, and the general mood of the market.
Two honest caveats. First, one month is short — deriving a trend from it would be premature; this is a snapshot, not a time-series finding. Second, the expensive brackets hold 597 and 250 cards, far fewer than the cheap ones, so individual cards carry more weight there.
The extremes — and why they mislead
Every dataset like this contains cards that multiplied in value. Here they include a Latios ex from EX Dragon (€63.72 to €352.97) and a Gardevoir & Sylveon GX from Unbroken Bonds (€385.27 to €1,365.73). In the other direction there are equally drastic cases with declines of over 80 percent.
Numbers like these are readily sold as "market movement". Usually they are not.
The trend price is an average of recently sold copies. For a card that changes hands dozens of times a day, that value is stable and meaningful. For a card sold perhaps three times a month, a single sale can multiply the figure — because a particularly well-preserved or particularly worn copy happened to change hands. The card is not suddenly worth four times as much; different copies simply formed the average.
Practical consequence: quadruple-digit percentage jumps on rarely traded cards are almost always an effect of thin trading volume, not a gain in value. That is exactly why this report centres on the median rather than the mean — otherwise a handful of such cards would have turned the overall picture positive, even though the market moved sideways.
For your own collection this means: if a single card appears to explode overnight, look at the number of listings. If there are only a few, be careful — selling at that price is usually not possible.
What this means in practice
For collectors: a month without movement is normal and no cause for concern. A collection's value builds over years, not weeks. Checking the total daily mostly shows you noise.
For sellers: the figures argue for selling cheap cards regardless of market conditions — they barely move anyway. For expensive cards, look at the history rather than the daily price. What else matters when selling is covered in Selling Pokémon Cards.
For buyers: a weaker segment above €100 means more room to negotiate. It does not mean prices will keep falling — no forecast can be derived from 30 days, and this report deliberately does not attempt one. How prices developed after big releases in the past is covered in Pokémon 30th Celebration: Is Waiting Worth It?
What the report does not say: nothing about individual cards, nothing about the coming months, and nothing about whether trading cards are a sensible investment. It describes what measurably happened in 30 days — no more.
The same view of your own collection
This report is built on the same data available to every account: trend prices per card, updated daily, with history over time.
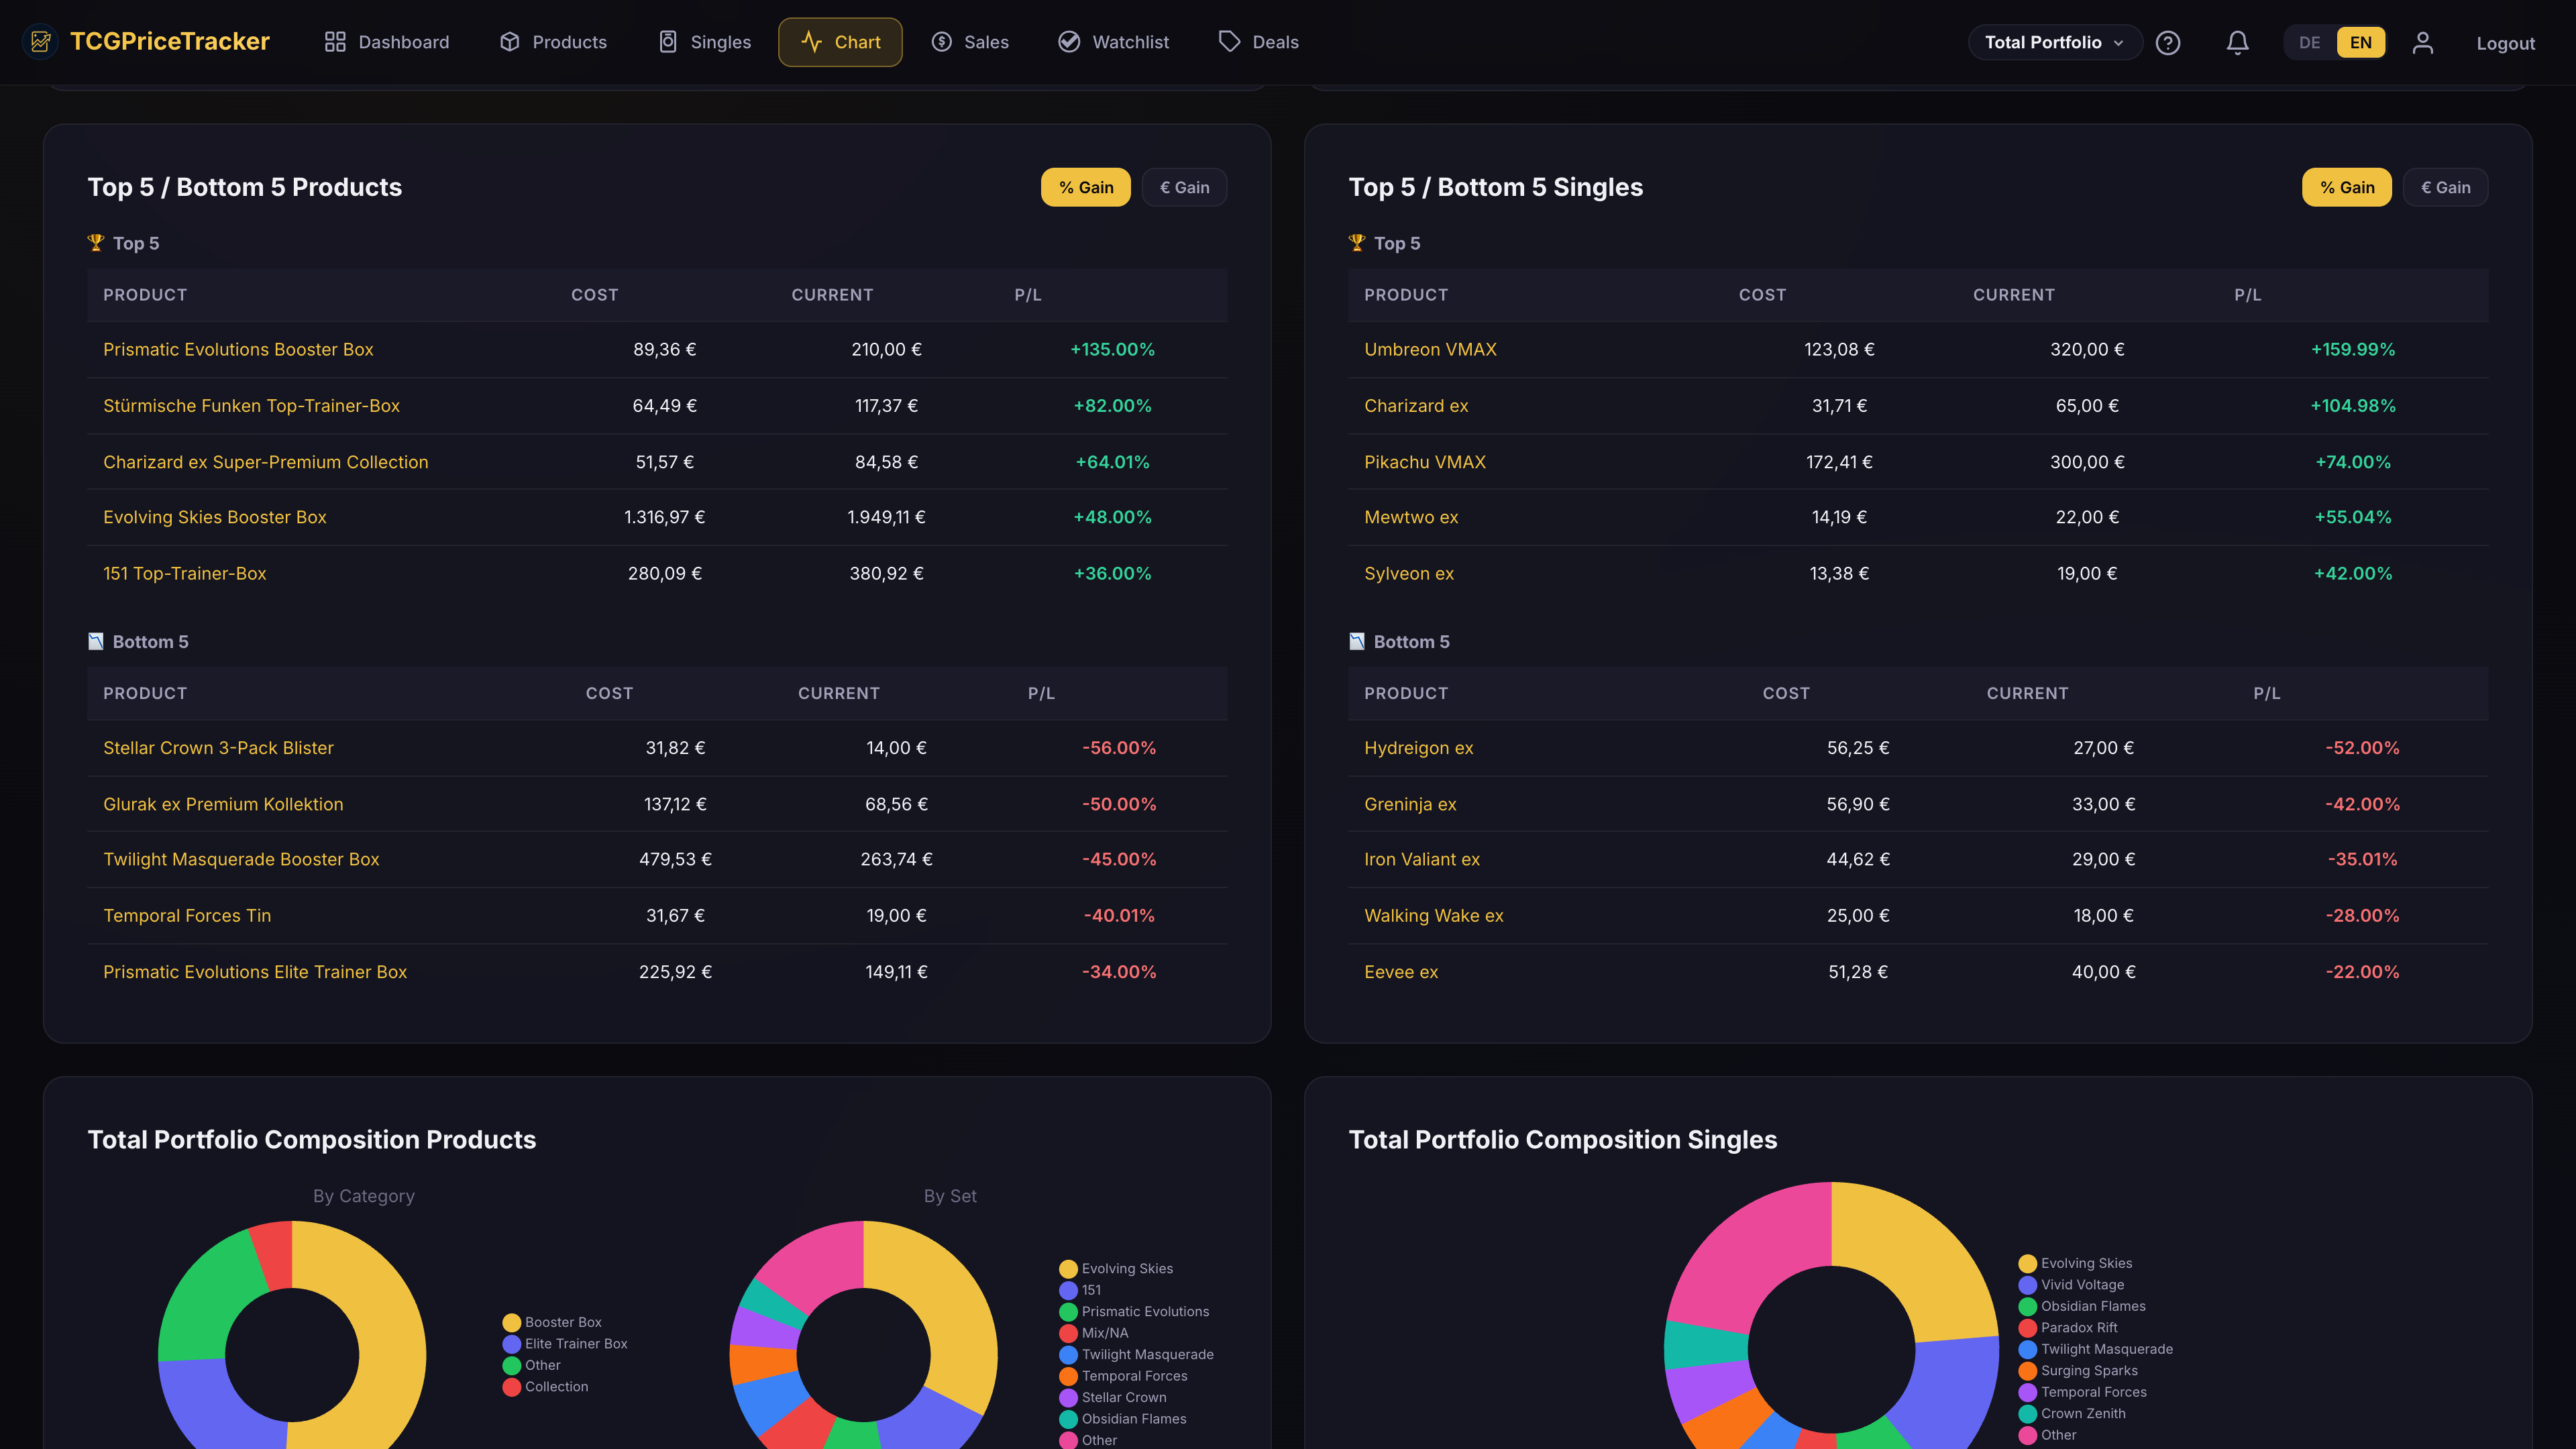
The difference is the cut. Here you see the market as a whole; in the tool you see your cards — with total value, a history chart and the development of each position. That answers the question this report deliberately leaves open: whether your collection follows the market picture or diverges from it.
How to record your cards is covered in Determining Pokémon Card Value; how that turns into a lasting picture, in Tracking a Card Portfolio.
Keep an eye on your collection
Trend prices per card, updated daily, with total value and history. Free, no credit card.
Start for free →Frequently asked questions
Are Pokémon cards going up or down right now?
In the measured month from 13 July to 12 August 2026, neither: the median card lost 0.7 percent, 42 percent rose, 51 percent fell. The market moved sideways. Differences only appear by price bracket — cards above €100 gave up 6.4 percent on median, cards under €20 stood still.
Why only analyse one month?
Because the comparison requires the same card to have a price on both reference dates. The further back the first date sits, the smaller that overlap becomes and the less the result says about the market. A rolling 30-day window additionally keeps the reports comparable with one another.
Why the median rather than the mean?
Because individual cards multiplied in value and would badly distort a mean. The median describes the middle card and is unaffected by outliers. With a mean, the same dataset would have given a far more positive impression, even though more cards fell than rose.
One of my cards rose 300 percent — is it worth that now?
Probably not. On rarely traded cards the trend price reflects only a few sales, so a single well-preserved copy can multiply the figure. Check the number of current listings: if there are only a few, the price is not reliable. Only repeated sales at the new level confirm a genuine gain.
Can you tell from this what happens next?
No. Thirty days is a snapshot, not a trend statement, and this report deliberately contains no forecast. Trading cards are not regulated financial products; their value can fluctuate and can fall.
Does the finding apply to Magic, Lorcana or One Piece too?
This analysis covers Pokémon only, because by far the most cards are tracked there. For the other games the data is currently too thin for reliable statements. Separate analyses will follow once that changes.
How often does the market report appear?
The plan is one report per month with the same structure and the same method, so the figures stay comparable. Any change to the method will be stated in the report concerned.
What is your collection doing?
Trend prices per card, updated daily, with total value and history. Start free, no credit card.
Start for free →